Consume data with Power BI and How to build a simple dashboard.

A Power BI dashboard is a single page, often called a canvas, that uses visualizations to tell a story. Because it is limited to one page, a well-designed dashboard contains only the most important elements of that story.
Columns
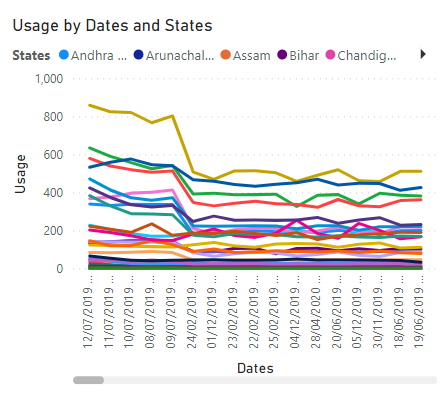
States
Regions
latitude
longitude
Dates
Usage
Steps to create a Power BI Dashboard.
- Load the data.

- Explore your dashboard.

- Choose the right Fields for Right Chart.
 1. Pi Chart


2. Line Chart
3. Map

4. Donut Chart

Live Dashboard

pin to dashboard --> pin live

DataSet Link is here.
Power BI Dashboard is here.


No comments:
Post a Comment