Introduction to Orange Tool

Introduction to Orange Tool:
- Orange is a component-based visual programming software package for data visualization, machine learning, data mining, and data analysis.
- Build data analysis workflows visually, with a large, diverse toolbox.
- It is an open-source project. download it from here.
- It is written in Python, Cython, C++, C.
Advantages:
- It is an open-source data mining package build on Python, NumPy, wrapped C, C++, and Qt.
- Works both as a script and with an ETL workflow GUI.
- The shortest script for doing training, cross-validation, algorithms comparison, and prediction.
- Orange the easiest tool to learn.
- Cross-platform GUI.
- Orange is written in python hence is easier for most programmers to learn.
- Has a better debugger. Scripting data mining categorization problems are simpler in Orange.
- Orange does not give optimum performance for association rules.
Limitations:
- Not super polished.
- The install is big since you need to install QT.
- A limited list of machine learning algorithms.
- Machine learning is not handled uniformly between the different libraries.
- Orange is weak in classical statistics; although it can compute basic statistical properties of the data, it provides no widgets for statistical testing.
- Reporting capabilities are limited to exporting visual representations of data models.
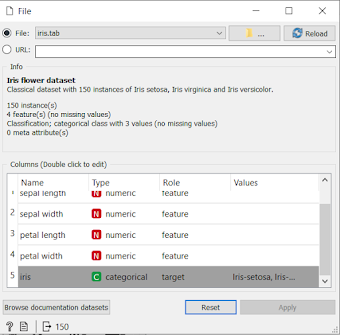
Importing data:
- open Orange tool.
- Add file widget into the canvas.
- Select data source file.
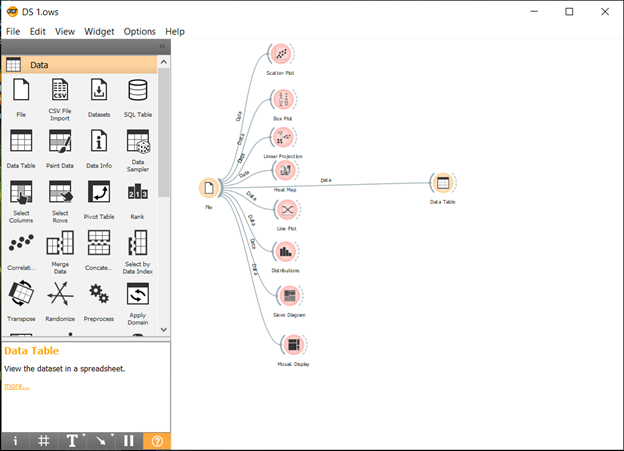
- Add different data visualization widgets

- Connect file widget with other visualization widgets

- Visualize the output by clicking widget.
 Line plot
 Sieve Diagram
 Distribution
Scatter Plot
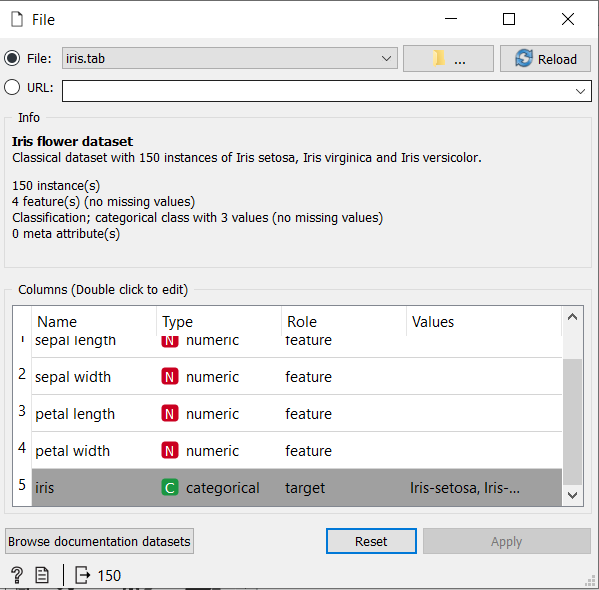


 File: The input data file is read by the file widget and the dataset is sent to its output channel. In the widget, the history of the most recently opened files is maintained.
 - CSV File Import: This widget reads datasets divided by a comma and transfers the dataset to its output channel. Commas, semicolons, spaces, tabs, or manually-defined delimiters maybe file separators.
- Datasets: The Dataset Widget retrieves and transfers the chosen dataset to the output of the server. The file is saved to the local memory and can then be reached automatically, even without an internet connexion.
- Data Table: This widget receives one or more input datasets and displays them as a spreadsheet.
- Data Info: A basic widget that contains information about the size, functionality, targets, meta attributes, and position of the dataset.
- Data Sampler: Many data sampling methods are introduced by the data sampler widget. It generates a sample and an external dataset.
- Select Columns: For manually writing the data domain, the Select Columns widget is used. The user will determine which attributes and how they will be used.
etc.

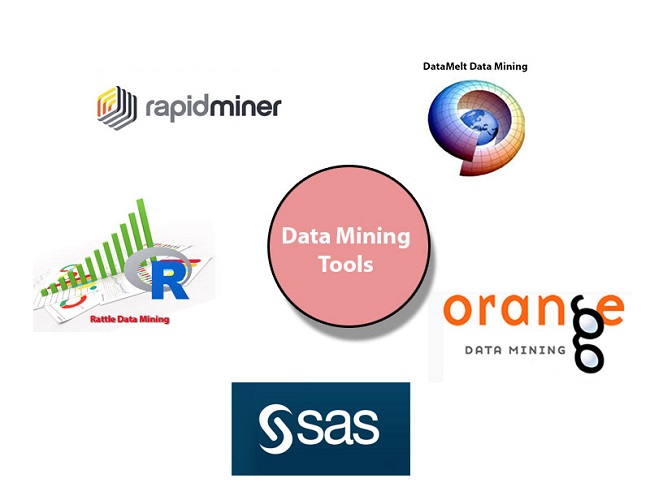
Overall Comparison of all tools:

References:
https://www.ionos.com/digitalguide/online-marketing/web-analytics/a-comparison-of-data-mining-tools/


No comments:
Post a Comment